| # | procedure | task(s) | language |
|---|---|---|---|
| 1 | overscan subtraction | ovsub_hpk ovsub_hpk_med | IRAF |
| 2 | distortion correction and combine chip 1 and 2 | bigimage | IRAF, C |
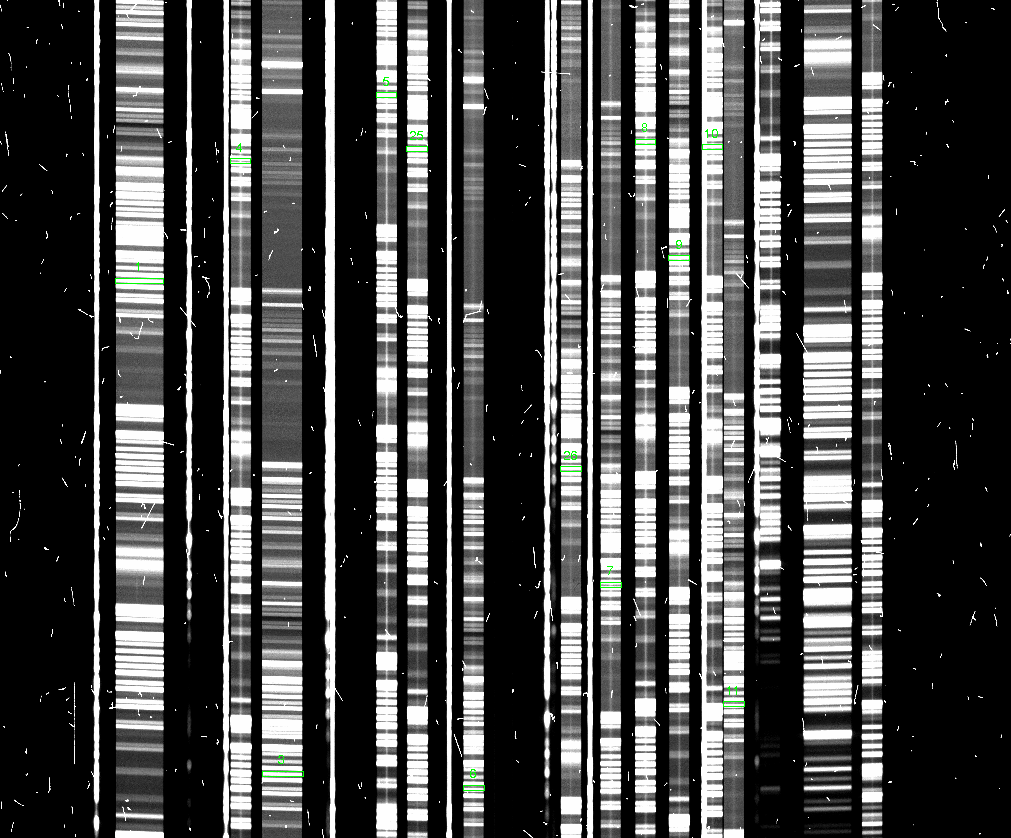
| 3 | extract spectra | speccomb mosextract | IRAF, C |
| 4 | creating comparison frame | mkcomparison | IRAF |
| 5 | identification of comparison/night-sky lines | mosident | IRAF |
focasred> ovsub_hpk @list.in @list.outThis task subtracts bias-level by using overscan regions in each channel.
ovsub_hpk_med instead
of ovsub_hpk.bigimage, flat-fielding should be done before it.focasred> bigimage chip1.fits chip2.fits output.fits obsmode=specThis task corrects for the instrument distortion and combines the two CCD images.
obsmode is set to spectroscopy,
not imaging.bigimage (option "distdata").
focasred> epar bigimageor
focasred> lpar bigimage
| Jun. 2010 - Jun. 2011 | : distdata=DistChipDat.HP.062910.dat |
| Oct. 2012 - | : distdata=DistChipDat.HP.101112.dat |
images.immatch.xregister can be used for
this purpose. See the example text above.focasred> mosextract input.fits input.sbrYou need the mask design file,
input.sbr, for this task.wmdp
and sent to the observatory for mask cutting before the observation.bigimage, please make sure to use the correct
distortion file (see above).| parameter name | description | more detailed information |
|---|---|---|
| distdata | distortion data file | the file is in
the directory FOCASRED/DATA/ |
| rot | MOS rotation in degree | During setupfield of MOS
observation, the MOS masks is rotated to match the angle of the mask and
the sky. If it is larger than 0.1 degree, this option should be used. This value is not recorded in FITS header and you need to check the observation log. Please consult SS if you don't have this information. |
| dx | shift for slit positions in pixel | This task creates a file named input.fits.reg. Open the input.fits image with DS9 and then load the .reg file. The positions of the slits will be shown. If you find a systematic shift between the actual and calculated positions of the slits, use this parameter to refine the positions of extraction. |
| mdpfile | optional mdp file for comments | If you specify a .mdp file with this option, the comments will be
stored in the FITS headers of extracted spectra. Note that the .mdp file must have the same number of targets as the .sbr file. |
input.fits.cl, which
can be used to check what are actually done.imcopy and hedit. |
This is an example of using the .reg file on DS9. |
| FOCASRED/DATA/barcode.dat | The information of grism and filter are stored in the FITS header. Because they are in barcode format, this file is used to convert the barcode to its actual name. (the name is only used within the task and the values of FITS header are not changed) |
|---|---|
| FOCASRED/DATA/specmode.dat | This file contains the nominal values for wavelength parameters such
as central wavelength, dispersion, and wavelength-range. They are selected according to the used grism and filter(s). If you want to change the wavelength range of extraction, you need to edit this file. |
speccomb for quickly checking MOS data.
mosextract except for the name
of output fits file.
focasred> speccomb input.fits input.sbr output.fitsIt has the same hidden parameters as
mosextract. |
This is an example of speccomb output. |
focasred> mkcomparison @list.blue @list.red @list.outThe parameters
list.blue and list.red are
the lists of input files which are extracted from arc-frame for
blue and red, respectively.mosextract.mosident uses the IRAF task
noao.onedspec.autoidentify combined with the approximate
wavelength information from mosextract.focasred> mosident @list.comp linedata="thar.300.dat" order=5It tries to identify the lines automatically but you have to check all of the identification visually and make correction if necessary.
| Grism | Filter | Spectrum | Line Data | Fitting Order | Typical RMS (with 0".8 slit) |
|---|---|---|---|---|---|
| 300R/300B | O58/Y47 | arc (ThAr) | thar.300.dat | 5 | 0.2 |
| 300R/300B | O58/Y47 | night sky | skyline.dat | 4 | 0.2-0.3 |
| 300B | none/L600 | arc (ThAr) | thar.300.dat | 5 | 0.2-0.3 |
| VPH520 | none/L600 | arc (ThAr) | thar.vphblue.dat | 4 | 0.2 |
| VPH850 | O58 | night sky | skyline.dat | 4 | 0.2-0.3 |
| VPH900 | O58 | night sky | skyline.dat | 4 | 0.1 |
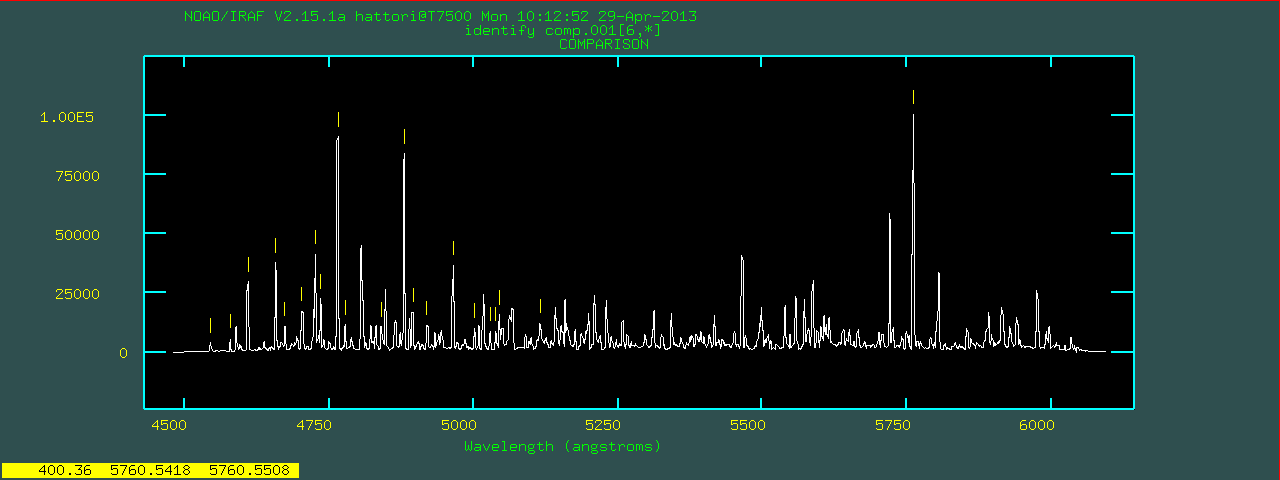
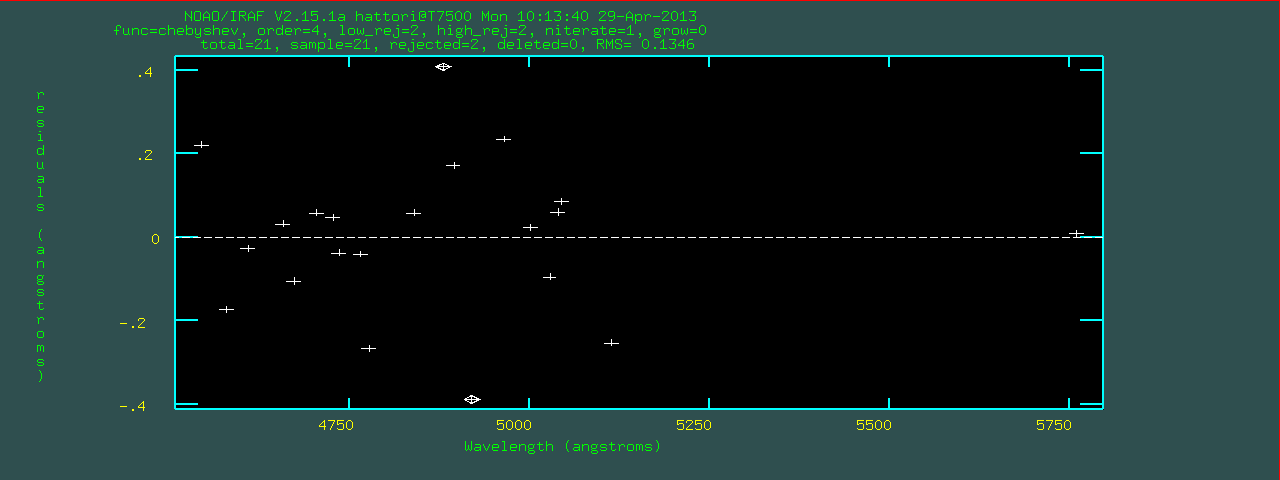
 focasred> mosident @list.comp linedata="thar.vphblue.dat" order=4
 autoidentify comp.001 5250.00 -0.780 coordlist=/home/hattori/FOCASRED//IRAF/thar.vphblue.dat section=column 6 aidpars.crpix=1028.1 aidpars.aidord=5 nsum=5 niter=1 order=4 func=cheb fwidth=3.14 logfile=mosident.log inter- dbwrite=YES

 AUTOIDENTIFY: NOAO/IRAF V2.15.1a hattori@T7500 Mon 10:12:08 29-Apr-2013
   Spectrum                 # Found   Midpoint Dispersion        RMS
   comp.001[6,*]                 31    5254.84     -0.783      0.757
 identify comp.001[6,*]
If
autoidentify finds a solution, identify will
be called next and you will see a plot like below.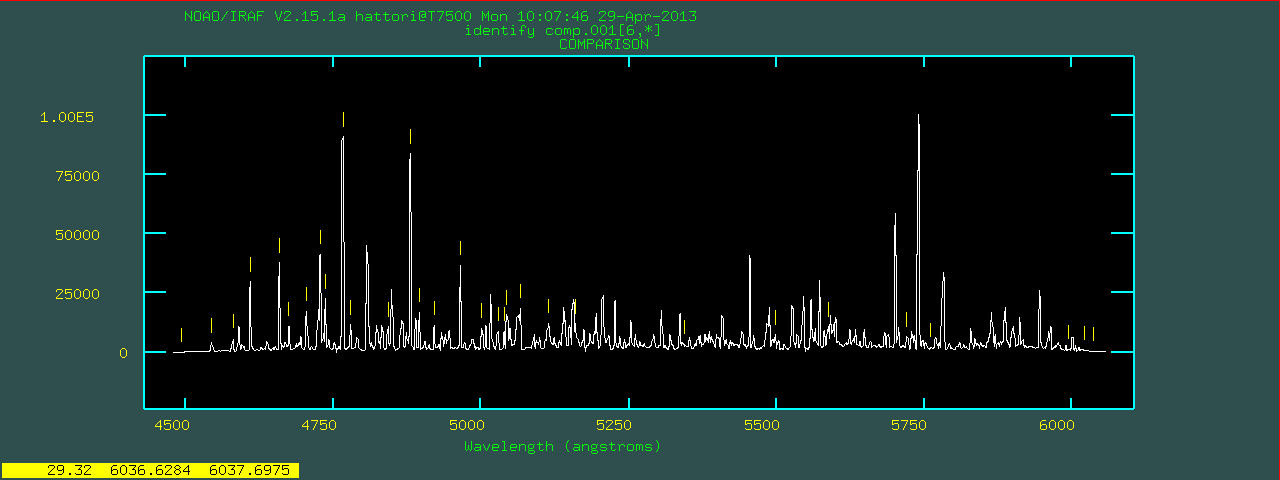
autoidentify cannot find a solution, mosident calls
reidentify and use the previous image as a reference.mosident for all of the comparison data.list.comp is a list of all comparison data.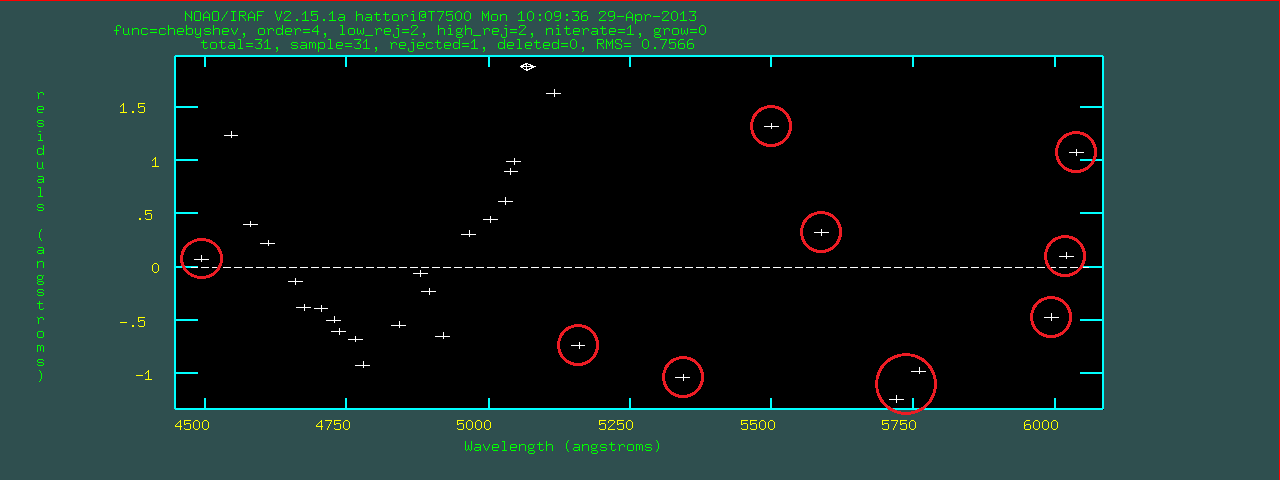
linedata=thar.vphblue.dat using the current fitting
solution (dispersion function).
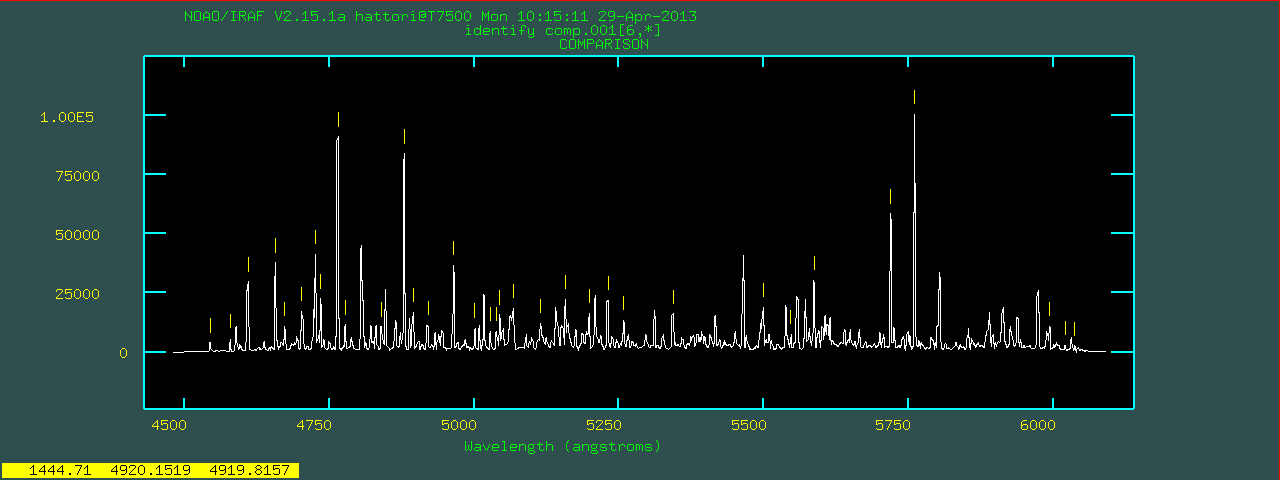
identify by pushing 'q' in the spectrum plot window.
 Write feature data to the database (yes)?

 REIDENTIFY: NOAO/IRAF V2.15.1a hattori@T7500 Mon 10:16:40 29-Apr-2013
   Reference image = comp.001, New image = comp.001, Refit = yes
           Image Data    Found     Fit Pix Shift  User Shift  Z Shift      RMS
 comp.001[1,*]          34/34   33/34     0.0415      -0.032  -6.6E-6    0.249
 comp.001[11,*]         34/34   33/34     -0.167       0.133  2.52E-5    0.265
 comp.001[16,*]         34/34   33/34     -0.168       0.132  2.58E-5    0.278
 comp.001[21,*]         34/34   32/34    -0.0689      0.0522  1.12E-5    0.261
 comp.001[26,*]         33/34   32/33     -0.153       0.122  2.33E-5    0.276
 comp.001[31,*]         32/33   30/32     -0.096      0.0769  1.45E-5    0.237
     ** Too many features lost **
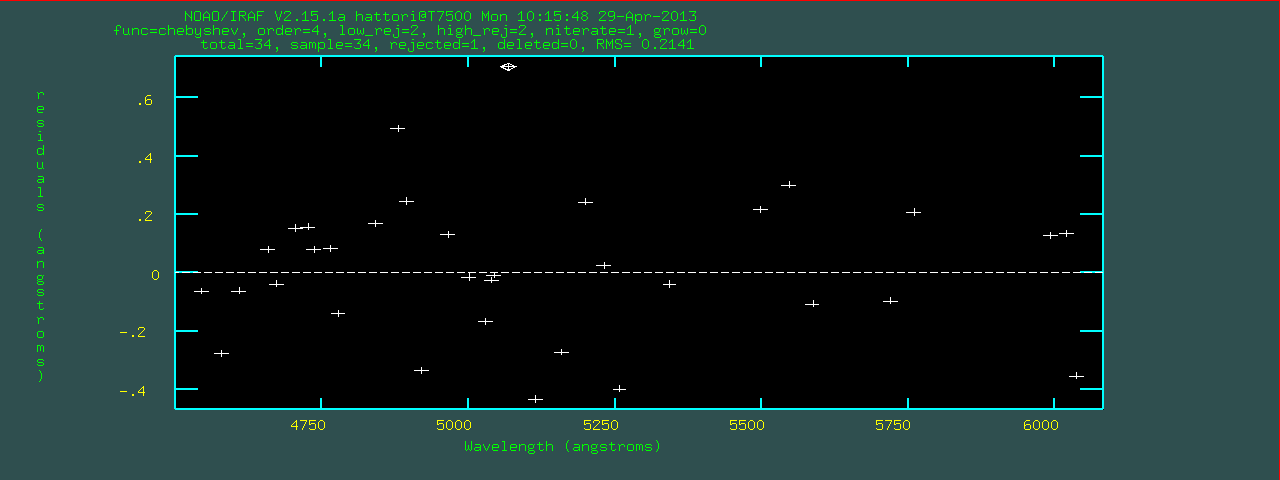
mosident then calls reidentify to identify/fit the other columns.
This part is automatically done but you should check the RMS values.mosident, reidentify is executed with nlost=2
(maximum number of line lost).reidentify manually.
 focasred> reident comp.001 comp.001 nlost=3 section="column 6" step=5 nsum=5

 REIDENTIFY: NOAO/IRAF V2.15.1a hattori@T7500 Mon 10:17:03 29-Apr-2013
   Reference image = comp.001, New image = comp.001, Refit = yes
           Image Data    Found     Fit Pix Shift  User Shift  Z Shift      RMS
 comp.001[36,*]         33/33   32/33     -0.148       0.119  2.23E-5    0.268
 comp.001[46,*]         33/33   32/33     -0.174       0.138  2.66E-5    0.222
 focasred>
identify and reidentify are only in one dimension.fitcoords.focasred> fitcoords @list.comp xorder=2 yorder=4The orders should be the lowest one which does not show systematic deviation in the fitting.
xorder=2 is enough for 10-20 arcsec-long slits.yorder should be same (or +1, maybe) as order in mosident.transform is used.transform accept only one set of fitting results, you need to repeat
executing the task for every slits; if you have 30 slits, you need to execute transform
30 times.mostrans can be used.mostrans @list.obj @list.obj.wc @list.comp y1=4000 y2=6050 dy=0.39In this case, the values of
y1, y2, dy (options for transform) are fixed
so that all of the output spectra have an identical dispersion function (the relation between pixel
coordinate and wavelength).