MOIRCS VPH Grism Information Page
Open with Limited Support: Observation under the Shared-Risk Policy
!! Most of the information below are for the previous detectors (for data before June 2015) !!
The actual values for the current page is to be updated after the on-sky test in May 2016. Sorry for any inconvenience.
For the proposal preparation, please use the current performance. You may also consider 30-40% increase of the sensitivity in YJ band if necessary.
Available grisms and sensitivities
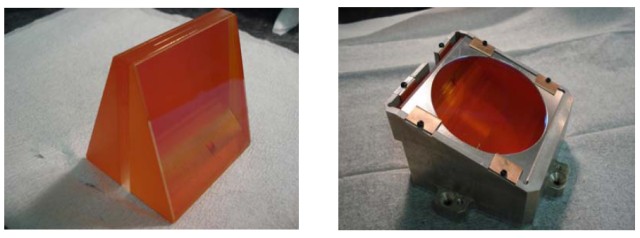
We have four high-resolution VPH grisms (VPH-Y, VPH-J, VPH-H, and VPH-K) for the open-use observations. The grisms are originally the user carry-in grisms, and the PI of each grism kindly donated them for the open use. We thank Prof. Takashi Ichikawa (Tohoku Univ: VPH-J and VPH-H), Prof. Toru Yamada (Tohoku Univ: VPH-K), and Dr. Kazuhiro Shimasaku (Tokyo Univ: VPH-Y) for their contribution to the community.
We summarize the basic characteristics of these VPH grisms here. Users who would like to use the grisms should fully understand their basic characteristics by reading the page and the reference paper by Dr. Ebizuka (below), as well as the reports at the end of the page if possible (in Japanese only). We stress that the use of the VPH grisms is NOT so easy: careless planning without understanding their characters may result in the failure of the observation. Please explicitly describe how your observation (scientific goal) is robust and executable under the current characteristics.
Important!!
It is strongly recommended that the observer who uses these grisms gives acknowledgment to providers in your papers when the data based on the grisms are to be published. And also, please refer to the paper by Dr. Noboru Ebizuka (Nagoya Univ) below.
- "Cryogenic Volume-Phase Holographic Grisms for MOIRCS"
Ebizuka, N. et al. Publications of the Astronomical Society of Japan, 2011, Vol.63, SP2, pp.605--612.
Specification
- The dispersion direction of the spectra on the detector is the opposite of that for R500 and R1300 grisms (e.g., decreasing x-direction is longer or redder wavelength for channel-2 raw image).
- The shift of the spectra to the spatial direction is large for all grisms. The shift values (in pixels) are summarized in the table below.
- The whole length of the spectra is very long. For example, the spectra by VPH-J + J filter is roughly ~1700 pixels. The whole spectra by VPH-H + H filter has nearly 4000 pixels, about double the size of the detector (spectra is cut out by the detector edge).
- The peak wavelength and throughput of the transmission curve will drastically change according to the slit position (see below).
The table below describes the basic specification of grisms.
| VPH-Y | VPH-J | VPH-H | VPH-K(5) | |
|---|---|---|---|---|
| Resolution(1) | 3180 | 3020 | 2940 | 2680 |
| Straight-through Wavelength [um](2) | 1.017 (Channel 1) 1.016 (Channel 2) |
1.235 (Channel 1) 1.236 (Channel 2) |
1.669 (Channel 1) 1.646 (Channel 2) |
2.178 (approx.) |
| Pixel Scale [A/pix] | 0.764 (Channel 1) 0.767 (Channel 2) |
0.955 (Channel 1) 0.958 (Channel 2) |
1.317 (Channel 1) 1.314 (Channel 2) |
1.94 |
| Shift of spectra in spatial direction [pix](3) | +27 (Channel 1) +76 (Channel 2) |
-40 (Channel 1) +52 (Channel 2) |
+135 (Channel 1) +80 (Channel 2) |
-355 (Channel 1) 240(4) (Channel 2) |
(1) From Ebizuka et al (2011) PASJ, S63, 605. These values are for 0.5"-width slit.
(2) The value will shift slightly along with the slit position used (x coordinate in raw image).
(3) In raw image coordinate. In the preimage coordinate, positive shift in y(raw) will be negative shift in X (preimg).
(4) Updated on April 2014.
(5) As of April 2014, the spectra show a tilt by about -1.5 deg and -1.0 deg for channel 1 and 2, respectively (clockwise rotation).
Grism Efficiency and its Characteristics
The figures below are examples of the efficiency curve for each grism (from Figure 9 of Ebizuka et al.). The efficiency here includes all the loss by telescope and MOIRCS as well as the atmosphere. The peak efficiency of each grism itself has been estimated to be 0.7-0.8.
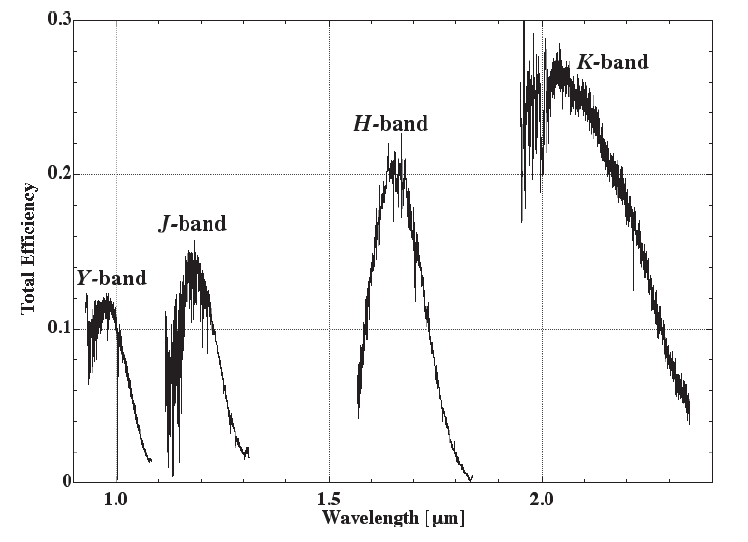
Figure 1: Grism efficiency curves. The figure is taken from Ebizuka et al.(2011). The sharp cut of the blue side of transmission curves is due to the detector edge. And also, the noise in the bluer part of the curve for the VPH-J and K is due to atmospheric absorption. Note that the position of the peak changes with the slit position as described below.
The important characteristics of these grisms are that the sensitivity curve will shift with the X-position (in raw image coordinates) of the slit. As an example, the behavior for VPH-HY, VPH-H, and VPH-K are each shown in Figure 2. The peak efficiency of the transmission curve is also known to change with X-position. For example, the negative offset of the slit will result in lower peak sensitivity (and vice versa) for VPH-Y. The situation is just opposite for VPH-K. The shift of the peak transmission curves is summarized in Figure 3.
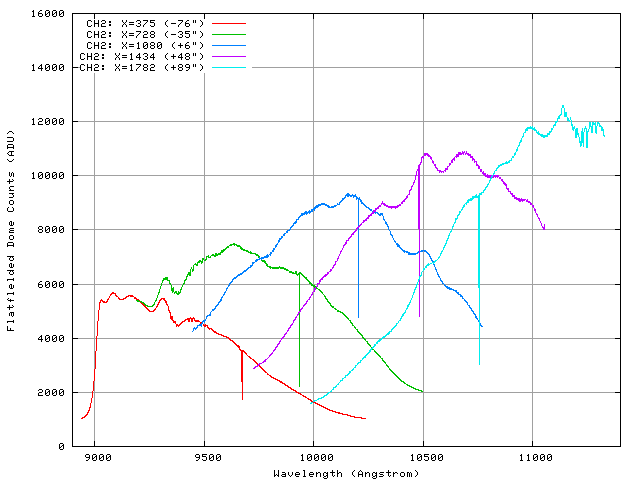
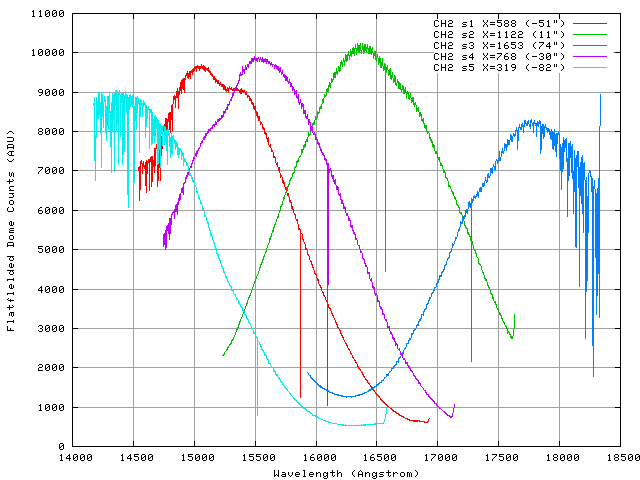
Figure 2a: The shift of efficiency curve for VPH-Y (left) and VPH-H (right) grism with the X-coordinates of the slit. The dome flats are used for the measurement. The wobbling pattern seen in VPH-Y is from the ripple in order-sorting filter and not real. The noise in VPH-H is due to the water absorption by the dome surface. The actual spectra may extend more 200 and 300 Angstrom longwards for VPHY and VPHH, respectively. Note that the zero-level may somewhat be affected by scattered light.
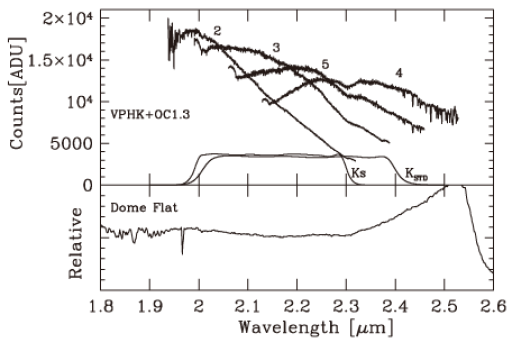
Figure 2b: The shift of efficiency for VPH-K grism with the slit x coordinates (ch2: the image from Tokoku et al.2012, in prep). The curve shown here is from the raw data, so the detector QE variation somewhat affects the data. In the data, the slit positions 2,3,4,5 each indicates the offset of -35", +7", +90, +48, respectively.
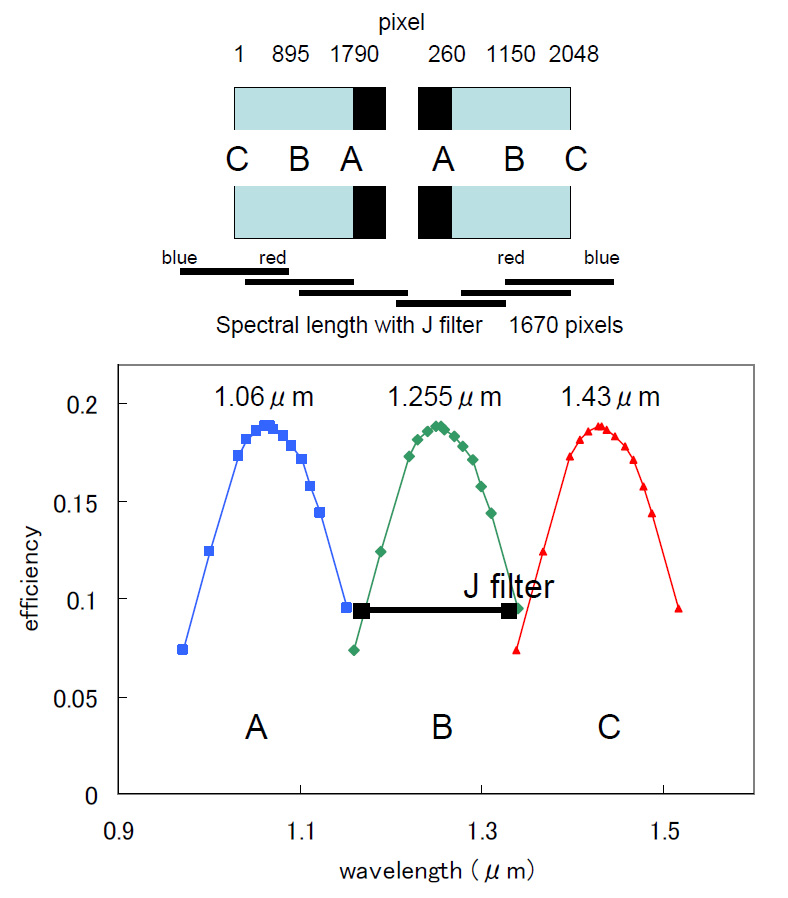
Figure 2c: The shift of efficiency for VPH-J grism with the slit x coordinates (from Ichikawa's 3rd report below). The curve shown here is not the actual data. Note that the actual observable wavelength range is not shown here. For example, we cannot observe shorter than 1.06um by VPH-J due to the detector edge.
The figure below (Fig. 3) is the summary of the shift of the peak with the slit position.
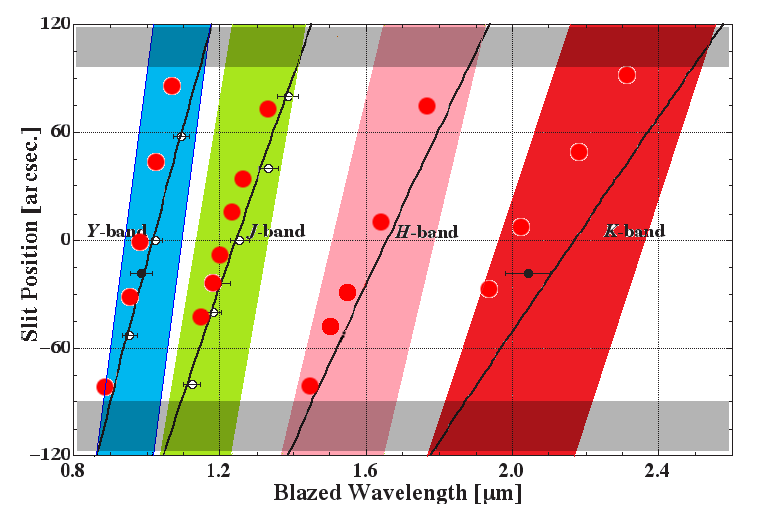
Figure 3: The shift of efficiency with the slit x coordinates (revised from the Figure 4 of Ebizuka et al. 2011). The vertical axis indicates the relative position of the slit: here the zero indicates the center of the detector (X=1024 in raw coordinates), and positive offset means that the slit goes outside (larger [smaller] X in raw coordinates in channel-2 [1]: or towards longer wavelength direction). The thick solid lines are the theoretical peak wavelength shift. Large red filled circles are the actual peak position measured in 2012. The shift of the measured peak from the theoretical line is generally seen. Especially, the deviation is large for VPH-K. The hatched region indicates the observable wavelength range for each grism: blue, green, pink, red region each indicates the range for VPH-Y, VPH-J, VPH-H, and VPH-K, respectively. Note that the region shown here is defined by the detector edge only: the actual spectra may not extend so due to the peaky efficiency curve. For example, the FWHM of the efficiency curve for VPH-H is roughly 0.15 um (see Fig. 2a), only half of the width of the pink region here. Users should pay enough attention to the actual observable wavelength range considering the efficiency curve shown in Figure 2. We also note that we cannot offset the slit less than -90 arcsec or more than 95 arcsec due to the design constraint (gray-shaded areas).
The wmdp Design
Due to the above characteristics, it is rather difficult to execute MOS mask design by the grism, as the target position virtually defines the observable wavelength range with high efficiency. It is also currently impossible to display the observable spectral range effectively by wmdp_moircs.sav, the MOIRCS mask design software. Therefore, the observatory cannot support the design of the VPHs by the wmdp software. Those who go to observation must manage the design by yourself. Please use the wmdp_moircs.sav only for putting slits on the target and generating .sbr file. Note that you can change the spectral parameters manually by the menu ("Option" -> "Grism Parameter Setting") so you can make mimicked spectra of VPH. See section 3.7.4 of the manual.
The Observation
Currently, the observing experience by these grisms is quite limited (no science data has ever been taken by VPH-Y and VPH-K before S12B). A more challenging aspect of the science observation would be the observation of the standard stars. The shift of the transmission curve with the slit position is so large that we need to take the spectroscopic standard star for each slit, which is totally impractical. As a compromise, we take standard star data at several positions across the region where we put the slits without slits (to save time). However, this will make the resolution of the standard star data seeing limited, and therefore the data will inevitably have different resolution as the science data. Currently, we have no good recipe for the standard star observation; we usually take standard star data by slitless spectroscopy at several positions on the detector. Therefore, we recommend the users to use the grism for science which does not critically require the standard star data.
Original VPH reports (Japanese only)
The link below lists the reports for the VPH-J and VPH-H that were prepared by Prof. T. Ichikawa. We would like to thank him for allowing us to open them.
!! CAUTION !! The OH line identification in VPHgrismReport2.pdf is wrong. The Efficiency curve for VPH-H in the report (i.e., Figure 1b) is also wrong. We thank Dr. Cristian Mayer and Dr. Masato Onodera for pointing out (2010-02-18).
Any questions should be directed to the Support Astronomer (Ichi Tanaka: e-address is below).